
Beer IoT: Building Universal Windows Application to monitor cooling process
Our beer cooling solution is not controllable through IoT Hub and it reports data there. We can control our device through simple command line application but it is not enough for us. In this post we start building Universal Windows Application that helps us monitor temperatures. In this post we focus on mobile application.
- Beer IoT: Measuring temperature with Windows 10 IoT Core and Raspberry Pi
- Beer IoT: Moving to ITemperatureClient interface
- Beer IoT: Measuring cooling rate
- Beer IoT: Making cooling rate calculation testable
- Beer IoT: Estimating beer cooling time
- Beer IoT: Reporting measurements to Azure IoT Hub
- Beer IoT: Using Stream Analytics to save data from IoT Hub to SQL database
- Beer IoT: Visualizing sensors data using Power BI
- Beer IoT: Building Universal Windows Application to monitor cooling process
Update. Source code of my TemperatureStation solution is available at Github. The solution contains IoT background service and web application you can use right away. Readings are reported to MSSQL or Azure IoT Hub. Documentation is available at TemperatureStation wiki. Feel free to try out the solution.
This far we can visualize cooling process by connecting Excel to SQL Server or by using SQL Server Reporting Services (SSRS). Excel doesn’t show us real-time data if we don’t refresh data source manually. SSRS is total overkill for our scenario and here we don’t even consider it. As cooling may take hours we want something that we can take with us if we need to go out and mobile application is the perfect match for this need.
WARNING! I’m not specialist on XAML and mobile applications and therefore please forgive me if my XAML or coding strategy doesn’t survive any criticism. Of course, please feel free to point out my sad mistakes so I can improve my poor skills.
Building mobile application
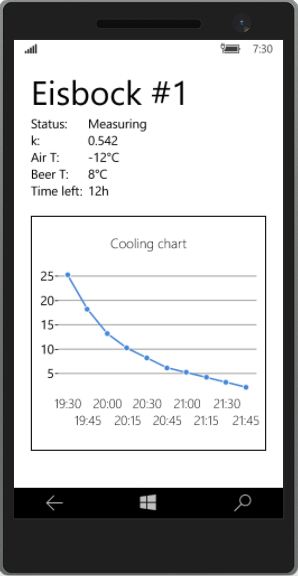
Image on right shows what will be the end result. To focus here on visualizing data we leave out reporting of cooling rate and cooling solution status. Initial and current temperatures we will get through Azure IoT Hub.
Our action plan here is simple:
- Create model for main view.
- Create main view with data and chart.
- Connect application to Azure IoT Hub.
I think for one post this is more than enough. If we generate more ideas for application then I can always write another post about it.
Creating measurement model
We start with creating a model we need in our application to show temperatures on chart.
[DataContract]
public class Measurement
{
    [DataMember(Name = "deviceId")]
    public string DeviceId;

    [DataMember(Name = "batchKey")]
    public string BatchKey;

    [DataMember(Name = "timeStamp")]
    public DateTime Timestamp;

    [DataMember(Name = "beerTemp")]
    public double BeerTemperature;

    [DataMember(Name = "ambientTemp")]
    public double AmbientTemperature;

    [DataMember(Name = "estimate")]
    public double Estimate;
}
This is actually the same data we send out from cooling solution background task.
Creating view model
Next model we need is view model that provides data to application main page. We are using INotifyPropertyChanged interface to notify page about changes in property values. Property called Data holds temperature data and it is observable because we want to add more measurements to this collection when measurements arrive from Azure IoT Hub.
public class BatchViewModel : INotifyPropertyChanged
{
    public ObservableCollection<Measurement> Data { get; private set; }
    public event PropertyChangedEventHandler PropertyChanged;
    private string _batchKey;
    private double _initialBeerTemperature;
    private double _currentBeerTemperature;
    private double _ambientTemperature;
    private string _message;

    public BatchViewModel()
    {
        Data = new ObservableCollection<Measurement>();
    }

    public string Message
    {
        get { return _message; }
        set { SetField(ref _message, value); }
    }

    public string BatchKey
    {
        get { return _batchKey; }
        set { SetField(ref _batchKey, value); }
    }

    public double InitialBeerTemperature
    {
        get { return _initialBeerTemperature; }
        set { SetField(ref _initialBeerTemperature, value); }
    }

    public double CurrentBeerTemperature
    {
        get { return _currentBeerTemperature; }
        set { SetField(ref _currentBeerTemperature, value); }
    }

    public double AmbientTemperature
    {
        get { return _ambientTemperature; }
        set { SetField(ref _ambientTemperature, value); }
    }

    protected void SetField<T>(ref T field, T value, [CallerMemberName] string propertyName = null)
    {
        if (EqualityComparer<T>.Default.Equals(field, value))
            return;

        field = value;
        OnPropertyChanged(propertyName);
    }

    protected virtual void OnPropertyChanged(string propertyName)
    {
        if (PropertyChanged != null)
            PropertyChanged(this, new PropertyChangedEventArgs(propertyName));
    }
}
Later we have add Azure IoT Hub reading to this model but right now we want to finish the main page of application.
Creating main page
Now let’s create main page that displays scooling chart. Add WinRTXamlToolkit.UWP and WinRTXamlToolkit.Controls.DataVisualization.UWP Nuget packages to project, open MainPage.xaml and take the XAML given below.
<Page
    x:Class="BeerIoT.Windows10Client.MainPage"
    xmlns="http://schemas.microsoft.com/winfx/2006/xaml/presentation"
    xmlns:x="http://schemas.microsoft.com/winfx/2006/xaml"
    xmlns:local="using:BeerIoT.Windows10Client"
    xmlns:d="http://schemas.microsoft.com/expression/blend/2008"
    xmlns:mc="http://schemas.openxmlformats.org/markup-compatibility/2006"
    xmlns:DataVis="using:WinRTXamlToolkit.Controls.DataVisualization"
    xmlns:Charting="using:WinRTXamlToolkit.Controls.DataVisualization.Charting"
    mc:Ignorable="d">

  <Grid Background="{ThemeResource ApplicationPageBackgroundThemeBrush}">
    <StackPanel Margin="20,20,20,20">
      <TextBlock Text="Eisbock #1" FontFamily="Segoe" Margin="0,0,0,0" FontSize="40" />
      <Grid>
        <Grid.ColumnDefinitions>
          <ColumnDefinition Width="Auto" />
          <ColumnDefinition Width="*" />
        </Grid.ColumnDefinitions>
        <Grid.RowDefinitions>
          <RowDefinition />
          <RowDefinition />
          <RowDefinition />
          <RowDefinition />
          <RowDefinition />
        </Grid.RowDefinitions>

        <TextBlock Grid.Column="0" Grid.Row="0" Text="Status:" Margin="0,0,10,0" />
        <TextBlock Grid.Column="1" Grid.Row="0" Text="Measuring" />
        <TextBlock Grid.Column="0" Grid.Row="1" Text="k:" Margin="0,0,10,0" />
        <TextBlock Grid.Column="1" Grid.Row="1" Text="0.542" />
        <TextBlock Grid.Column="0" Grid.Row="2" Text="Air T:" Margin="0,0,10,0" />        <TextBlock Grid.Column="1" Grid.Row="2" Text="-12°C" />
        <TextBlock Grid.Column="0" Grid.Row="3" Text="Beer T:" Margin="0,0,10,0" />
        <TextBlock Grid.Column="1" Grid.Row="3" Text="8°C" />
        <TextBlock Grid.Column="0" Grid.Row="4" Text="Time left" Margin="0,0,10,0" />
        <TextBlock Grid.Column="1" Grid.Row="4" Text="12h" />
      </Grid>

      <TextBlock Name="MsgText" TextWrapping="Wrap" Text="{Binding Message}"></TextBlock>

      <Charting:Chart Margin="0,20,0,0"  x:Name="LineChart" HorizontalAlignment="Left" VerticalAlignment="Top"
        Title="Cooling chart" BorderThickness="1" BorderBrush="Black">
        <Charting:LineSeries Margin="0" ItemsSource="{Binding Data}" IndependentValuePath="Timestamp"
          DependentValuePath="BeerTemperature" IsSelectionEnabled="True">
          <Charting:LineSeries.IndependentAxis>
            <Charting:DateTimeAxis IntervalType="Hours" Orientation="X">
            </Charting:DateTimeAxis>
          </Charting:LineSeries.IndependentAxis>
        </Charting:LineSeries>
        <Charting:Chart.LegendStyle>
          <Style TargetType="FrameworkElement">
            <Setter Property="Width" Value="0"/>
            <Setter Property="Height" Value="0"/>
          </Style>
        </Charting:Chart.LegendStyle>
        <Charting:Chart.Axes>
          <Charting:DateTimeAxis Title="t">
          </Charting:DateTimeAxis>
          <Charting:LinearAxis Title="T" />
        </Charting:Chart.Axes>
      </Charting:Chart>
    </StackPanel>
  </Grid>
</Page>
This is our page now. There are some fields for important data and then chart that shows beer temperature.
public sealed partial class MainPage : Page
{
    public MainPage()
    {
        this.InitializeComponent();
        Loaded += MainPage_Loaded;
        SizeChanged += MainPage_SizeChanged;
    }

    private void MainPage_SizeChanged(object sender, SizeChangedEventArgs e)
    {
        LineChart.Width = e.NewSize.Width - 40;
        LineChart.Height = LineChart.Width;
    }

    private void MainPage_Loaded(object sender, RoutedEventArgs e)
    {
        DataContext = new BatchViewModel();
    }
}
Now we are done with our main page and at least during this post we don’t have to make here any changes.
Connecting to Azure IoT Hub
Now comes the most complex part. As we can’t use convenient API libraries by Microsoft we have to find another way around. We go on by using Amqp.Net Lite AzureSBLite to read Azure IoT Hub as regular Event Hub.
Add the following packages to project:
- Amqp,Net Lite
- AzureSBLite
- Newtonsoft.JSON
Add the following two constants to BatchViewModel class.
private const string connectionString = "SbConnectionAndSharedKey";
private const string _eventHubName = "YourEventHubName";
To read data from Azure IoT hub we need method that runs on separate thread. We can’t use timer as we make blocking calls to service bus to read events. If we use timer then it’s possible that timer callbacks are piling up waiting for incoming messages and we run out from resources.
private void ImportEvents()
{
    while (true)
    {
        try
        {
            var client = EventHubClient.CreateFromConnectionString(connectionString, _eventHubName);
            var group = client.GetDefaultConsumerGroup();

            for (var i = 0; i < 2; i++)
            {                var receiver = group.CreateReceiver(i.ToString(), DateTime.UtcNow);

                EventData eventData = null;
                while ((eventData = receiver.Receive()) != null)
                {
                    var messageBytes = eventData.GetBytes();                    var messageText = Encoding.ASCII.GetString(messageBytes);
                    var measurement = JsonConvert.DeserializeObject<Measurement>(messageText);
                    _taskFactory.StartNew(() => Message = messageText);
                    _taskFactory.StartNew(() => Data.Add(measurement));
                    eventData.Dispose();
                }

                receiver.Close();
            }
        }
        catch (Exception ex)
        {
            _taskFactory.StartNew(() => Message = ex.ToString());
        }
    }
}
We call this method out when view model is created but we call it as a task on separate thread so it doesn’t block user interface.
public BatchViewModel()
{
    Data = new ObservableCollection<Measurement>();

    _taskFactory = new TaskFactory(TaskScheduler.FromCurrentSynchronizationContext());

    _randomizer = new Random();
    Task.Run(() => ImportEvents());
}
This is it. Now we are done with our simple mobile application and it’s time try out how it works.
Testing mobile application
As we can’t run IoT application and Windows Phone application same time on Visual Studio debugger we have to choose which one to take. I prefer to run background service on debugger.
Let’s go step by step:
- Run Stream Analytics job.
- Build mobile application and deploy it to your Windows Phone 10.
- Run mobile application.
- Run RaspberryPI background process on Visual Studio debugger,
- Watch Windows Phone application adding new data points to chart.
Wrapping up
Now we have our custom Windows 10 universal application to visualize sensors data. We can modify main page to make the application nice also on Windows 10 desktop machines. There are many ways how to improve and update this application but basic work is now done and we can use this application like it is.


Pingback:Bitcoin and Blockchain Tech Are Fueling a Fourth Industrial Revolution – btc news - coinbuzznow