ASP.NET Core introduces Node services that allow applications to run Node scripts on server. We can send data from controller action to Node script and get back some output we can use in view. This blog post shows how to use Node services to render d3.js charts on server-side to PNG files.
Why Node services
Node has tons of modules available and ready for use. Before Node services there were no good way in ASP.NET Core to run Node scripts on such a generalized way than now. We can install node modules, write our own ones and call these from controllers to get back some data or to get something important done.
Related closely to Node services there are some other services in ASP.NET Core that may interest reader who finds this post useful:
- SPA services
- Angular services (in beta)
- React services (in beta)
For good overview I suggest MSDB blog post Building Single Page Applications on ASP.NET Core with JavaScriptServices.
Adding Node services
To use Node services we have to add reference to NuGet package Microsoft.AspNetCore.NodeServices. After this we need to register Node services so we can use them in controllers through framework-level dependency injection. This is done in ConfigureServices() method of Startup class.
public void ConfigureServices(IServiceCollection services)
{
    services.AddNodeServices();
    services.AddMvc();
}
Now Node services are ready for use.
Initializing chart
Let’s initialize chart from MVC controller. For this let’s add new action called Chart to Home controller. Here is the code.
public async Task<IActionResult> Chart([FromServices] INodeServices nodeServices)
{
    var options = new { width = 400, height = 200 };

    var data = new[] {
        new { label = "Abulia", count = 10 },
        new { label = "Betelgeuse", count = 20 },
        new { label = "Cantaloupe", count = 30 },
        new { label = "Dijkstra", count = 40 }
    };

    ViewData["ChartImage"] = await nodeServices.InvokeAsync<string>("NodeChart.js", options, data);

    return View();
}
We create anonymous objects for options and chart data. We can use options defined here to be dynamic and configurable by user. Chart data here is static in sample purposes but in real application there will be query to some data source where chart data is stored. To render chart we use instance of INodeServices to call out Node script. Notice how options and data are given to Node script.
Displaying chart on view
Before jumping to JavaScript let’s define simple view to display our chart.
@{
    ViewData["Title"] = "Chart";
}
<h2>@ViewData["Title"]</h2>

<p><img src="@Html.Raw(ViewData["ChartImage"])" /></p>
One hint can be read out from view: chart image will be inline image.
Installing Node modules
In this point I expect that Node is installed to box where web application runs and it is configured correctly. Before we can write our Node script we have to install all modules we use.
- Open command line and move to web application root folder (not under wwwroot)
- Run npm install –save svg2png
- Run npm install –save jsdom
- Run npm install –save d3
Ignore errors and warning about packages.json file as things work still well.
Building chart and converting SVG to PNG
Now let’s write script that generates chart and transforms it to PNG image. For this let’s add file called NodeChart.js to root folder of our web application.
Here is the script with some code comments to clarify what it does. In short, we create disconnected HTML DOM, attach it to D3, generate chart and then convert SVG to PNG. After this we return PNG as inline image back to controller.
// Include all modules we need
const svg2png = require("svg2png");
const { JSDOM } = require("jsdom");
const d3 = require('d3');

// Define module
// callback - function to return data to caller
// options - chart options defined in controller
// data - chart data coming from controller
module.exports = function(callback, options, data) {

    // Create disconnected HTML DOM and attach it to D3
    var dom = new JSDOM('<html><body><div id="chart"></div></html>');
    dom.window.d3 = d3.select(dom.window.document);

    // Build D3 chart
    var width = options.width || 360;
    var height = options.height || 360;
    var radius = Math.min(width, height) / 2;

    var color = d3.scaleOrdinal(d3.schemeCategory20b);

    var svg = dom.window.d3.select('#chart')
        .append('svg')
        .attr('width', width)
        .attr('height', height)
        .append('g')
        .attr('transform', 'translate(' + (width / 2) +
        ',' + (height / 2) + ')');

    var arc = d3.arc()
        .innerRadius(0)
        .outerRadius(radius);

    var pie = d3.pie()
        .value(function(d) { return d.count; })
        .sort(null);

    var path = svg.selectAll('path')
        .data(pie(data))
        .enter()
        .append('path')
        .attr('d', arc)
        .attr('fill', function(d) {
            return color(d.data.label);
        });

    // Convert SVG to PNG and return it to controller
    var svgText = dom.window.d3.select('#chart').html();
    svg2png(Buffer.from(svgText), { width: width, height: height })
        .then(buffer => 'data:image/png;base64,' + buffer.toString('base64'))
        .then(buffer => callback(null, buffer));
};
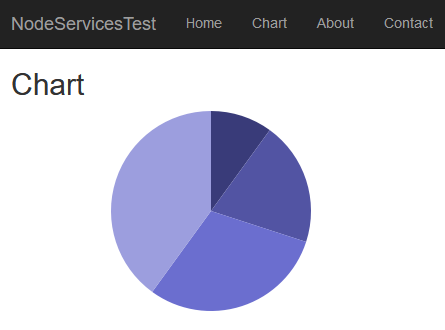
Here is the chart view with simple pie chart that was built in Node on server.
The code above can be used also as a starting point for some more complex server-side chart.
There are also other ways to get SVG to image (SVG => Canvas => data URI) but the method used here is easy and powerful enough. It doesn’t need any additional software to be installed on server and therefore it is less demanding about technical environment.
References
- Building Single Page Applications on ASP.NET Core with JavaScriptServices (MSDN)
- Server side SVG via D3 & jsdom (bl.ocks.org)
- jsdom (GitHub)
- D3.js Step by Step: A Basic Pie Chart (Zero Viscosity)
View Comments (12)
I get black pie. Any idea why?
Replace the var color line with
var color = d3.scaleOrdinal().range(['#A60F2B', '#648C85', '#B3F2C9', '#528C18', '#C3F25C']);
I followed the instructions but get an
NodeInvocationException: Cannot find module 'G:\Finanzen_Betrieb\Informatik\Dokumentation\03-Applikationen\Phoenix\sourcen\TransportWesen\NodeChart.js' Error: Cannot find module 'G:\Finanzen_Betrieb\Informatik\Dokumentation\03-Applikationen\Phoenix\sourcen\TransportWesen\NodeChart.js'at Function.Module._resolveFilename (internal/modules/cjs/loader.js:581:15)at Function.Module._load (internal/modules/cjs/loader.js:507:25)at Module.require (internal/modules/cjs/loader.js:637:17)at require (internal/modules/cjs/helpers.js:22:18)at C:\Users\hoffmannp\AppData\Local\Temp\4ptswx05.jbc:161:33at IncomingMessage. (C:\Users\hoffmannp\AppData\Local\Temp\4ptswx05.jbc:186:37)at IncomingMessage.emit (events.js:194:15)at endReadableNT (_stream_readable.js:1103:12)at process._tickCallback (internal/process/next_tick.js:63:19)
Any idea ?
It seems like there's no NodeChart.js file in root folder of web application. Do you have this file with script given above before chart image?
Hi Gunnar,
thanks for your support. Some minutes later I solved the issue on my own, at a first glance I didn't see that the script is mandatory. ;-) But now I get the next one:
NodeInvocationException: Cannot convert undefined or null to object TypeError: Cannot convert undefined or null to objectat slice ()at Function.scale.range (G:\Finanzen_Betrieb\Informatik\Dokumentation\03-Applikationen\Phoenix\sourcen\Transportwesen\node_modules\d3-scale\dist\d3-scale.js:57:46)at Function.initRange (G:\Finanzen_Betrieb\Informatik\Dokumentation\03-Applikationen\Phoenix\sourcen\Transportwesen\node_modules\d3-scale\dist\d3-scale.js:11:18)at Object.ordinal [as scaleOrdinal] (G:\Finanzen_Betrieb\Informatik\Dokumentation\03-Applikationen\Phoenix\sourcen\Transportwesen\node_modules\d3-scale\dist\d3-scale.js:68:13)at module.exports (G:\Finanzen_Betrieb\Informatik\Dokumentation\03-Applikationen\Phoenix\sourcen\Transportwesen\NodeChart.js:22:17)at C:\Users\hoffmannp\AppData\Local\Temp\jh0epaas.lcx:166:18at IncomingMessage. (C:\Users\hoffmannp\AppData\Local\Temp\jh0epaas.lcx:186:37)at IncomingMessage.emit (events.js:194:15)at endReadableNT (_stream_readable.js:1103:12)at process._tickCallback (internal/process/next_tick.js:63:19)
in ViewData["ChartImage"] = await nodeServices.InvokeAsync("NodeChart.js", options, data);
???
Any idea ? otherwise I could send you the whole project
Something in input data seems to be null. NodeChart.js line 22 seems to be it by stack trace.
Hello, can i use that technique to build API that return image created from d3 and nodejs?
Yes, you can. If this is all you need then I would consider using some nodejs web server instead. I mean you have nodejs there anyway.
Hi Gunnar, any examples of how to use nodejs charts with GenericHost of dotnet.core 2.1?
I don't have an MVC in my services and we don't want to have it.
this project should be running as background script from active batch.
Hi Gunnar,
Thank you for this great article. I have setup everything and it works beautifully. However, what is not entirely clear to me is how would this work in a production environment? Do I deploy the node_modules folder or can I combine this with webpack?
Could you please give a short and quick rundown on how this would be handled? Thanks.
Great article! Unfortunately INodeServices is depreciated now, mentions using Microsoft.AspNetCore.SpaServices.Extensions. Do you have an example using that? Thank you!
Hi there colleagues, its wonderful paragraph on the topic of
cultureand completely defined, keep it up all the time.