I found very cool small profiler that can also be used on production sites to quickly detect bottle necks in web application code. The profiler is called MiniProfiler and in this posting I will introduce you how to use it in your code.
As a first thing you must have some web application. Although profiler name in Google repository refers to MVC you can use it with any other web application type. I suppose you have ASP.NET MVC application.
NB! Sam Saffron wrote very good story about MiniProfiler. You can find it from his blog and it is titled as Profiling your website like a true Ninja. I really suggest you to read it.
Adding profiler to project
As a first thing you should add library package reference to MiniProfiler like shown on the following screenshot fragment.
After you added reference it’s time to start and stop profiler. We do it in BeginRequest and EndRequest events of our application class. Open global.asax and paste the following code there.
protected void Application_BeginRequest()
{
    if (Request.IsLocal)
    {
        MiniProfiler.Start();
    }
}

protected void Application_EndRequest()
{
    MiniProfiler.Stop();
}
It’s time to add some profiling code now.
public ActionResult Index(int page = 1)
{
    var profiler = MiniProfiler.Current;
    using (profiler.Step("Load events"))
    {
        PagedResult<Event> events = _context.ListPublicEvents(page);
        return View(events);
    }
}
And here’s how we can show profile on our pages. Just add MiniProfiler call to the head of your master page.
<head>
    @MvcMiniProfiler.MiniProfiler.RenderIncludes()
</head>
That’s it. Let’s take look now what it produces.
Viewing profiler output
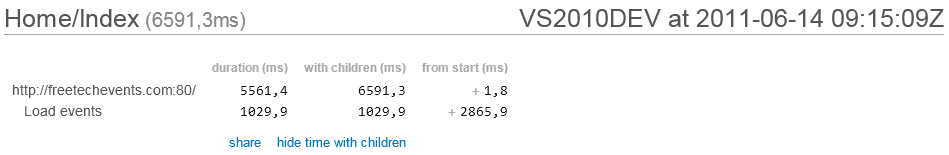
When we run our application and open the page with profiled code we can see the following result when we click on profiler timing icon.
You can also share profile trace with your friends by clicking share link on trace popup.
Of course, if you have more profiling messages you will see longer list.
I tried but my code looks awful…
Well… it seems like you have to move some code out from your controller methods. If your controller actions code gets messy and complex when using profiling messages there is good chance that you have to move some to some other layers (maybe add some new service classes etc).
If your controller code has no multiple responsibilities then it has practically simple flow and adding MiniProfiler profiling messages doesn’t make it look like mess.
Conclusion
MiniProfiler is small and very promising web applications profiling tool that adds no remarkable overhead to applications. It is easy to use and it generates nice profiling output that you also can share with your colleagues. If your controller actions are coded well then MiniProfiler adds no overhead to your code and it doesn’t make it look like mess. You can use MiniProfiler also to catch database queries generated by Linq To SQL and Entity Framework.
View Comments (3)
How can i use MiniProfiler with Medium Trust?
Can we use miniprofiler for Non MVC ASP.NET application, Normal ASP.NET application.
Yes, it works with ASP.NET Forms too :)