Why NOT measure progress using subjective percents
The first busiest part of year is successfully survived and it’s time to go on with business tuesday blog posts again. As I’m working on some progress measuring features for some time I will document here my ideas about this topic on more general level so business people can also read about my experiences and ideas. This time we make deep-dive to percents that describe how much task in progress is completed.
Convenient simplification
When percent of task completed came to software development it looked like excellent idea. Instead of complex calculations managers can update just one number is their Excel to get idea where developers are with given task. And for developers it should be easy to say this one number. We can rely on percent and everybody is happy – it’s easy to get and easy to use.
Theory and practice
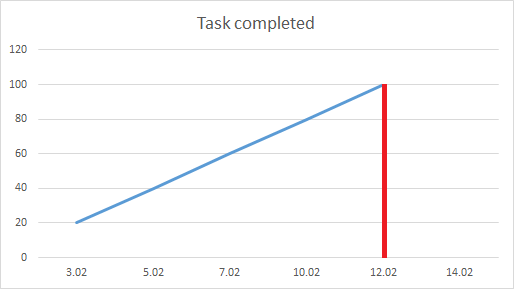
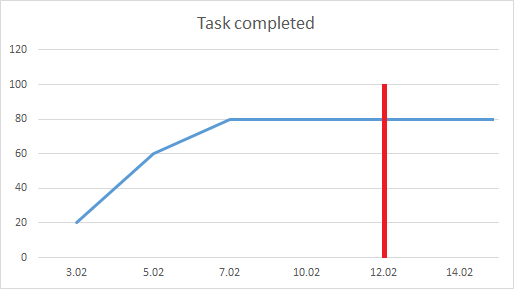
Later it turned out that it is not easy to measure creative work this way and maybe the best way to illustrate the problem is to compare following two charts. Red line on both charts marks deadline.
This is the ideal case where task completes smooth:

Here is one bad hidden bomb that makes chart in practice too often look like this:

Second chart should make us really worried about situation. Why we reach quickly to some high percent? Why the progress regardless of efforts gets stuck on this percent? Why it is going over deadlines?
What went wrong?
Percents can be measured with not much care when we do something we can measure by eyes. By example, around how much sand is moved from pile to sandbox? We can take a look at pile of sand and give our estimate about how much sand we have moved this far. Even if we don’t be very careful on deciding about this number the error is not markable or fatal.
But coding is creative work where only constant things are changes. The percent that was accurate yesterday may turn to be too optimistic or total overkill tomorrow. Besides this there is often room for technical problems, customer may change their mind and maybe some aspects of functionalities are not communicated perfectly. Having this much uncertainty makes it almost impossible to just estimate the progress in one number by just saying it based on feelings.
The mystery on straight line
The straight line on second chart is still mystery for us. What is the anatomy of progress and how we get to this straight line? Why the line stays straight for so long?
In practice I have seen many times how tasks by their content can be split to three parts:
- well understandable and in most case well estimated sequence of steps,
- not predictable steps like changes, technical problems and workarounds,
- communication problems, changes and fixes.
With these parts in mind we can say that progress is almost well estimated during the diagonal part of line. Why? Because this is the time when developers work on the first part of task. They know well what and how to do and in some point of time they are sure that this part is done now.
Now we are on the first point of straight line. Predictable and controllable technical work is done and developers left room for bug fixes and some minor changes. Now things get interesting: nobody is able to say what is happening next. Is customer okay with work done? Are there any changes? When we get last technical problems completely solved? Nobody knows and developers cannot say any accurate numbers anymore. They take what comes back to them and work on bug fixes and changes accepted with customer. But they don’t know how much bugs or changes are coming.
Until this uncertainty is in the air the line keeps running straight.
More accurate percents
It’s still possible to get more accurate percents but they are result of calculations. What kind of calculations we can do? Some popular ones are listed here:
- how much estimated time is consumed?
- how many estimated resources are consumed?
- is task financially in danger or not?
For these calculations we need time tracking and some mechanism to match tasks with fincances. We cannot rely on numbers that people take from air. These numbers are facts about current situation and they don’t tell us anything about future. Of course, it’s possible to estimate the progress if we are good at doing it. Still calculating trends is separate topic to discuss.
Conclusion
Although percent about progress of task said by developers seem to be easy instrument to use, this number has serious conceptual problems and contains too much uncertainties and hard to estimate risks. Comparing ideal and real-life based charts we can see that anatomy of this percent is way different than theory expects. Yes, we need to measure the progress but we should use more accurate numbers and understand that monitoring progress is totally different activity than making predictions about progress or calculating trends. Percents that give us more accurate but not absolutely accurate information can be calculated from work logs if developers have good reporting discipline.


Pingback:Reading Notes 2014-03-17 | Matricis