Using ETW tracing on Windows 10 IoT Core
Here is how to make custom event source for ETW (Event Tracing for Windows) work on Windows 10 IoT Core. It’s not so simple as developers of business solutions are used with Microsoft tooling on other areas but it’s not also something too complex or time consuming to do. This blog post introduces simple logging class and steps to make it work on Windows 10 IoT Core.
NB! Source code here comes from my TemperatureStation IoT solution that is available on Github.
Creating ETW event source
Here is the class I’m using for logging to ETW trace on RaspberryPi. I’m using custom ILogger interface to support more different loggers.
internal sealed class TemperatureStationEventSource : EventSource, ILogger
{
[Event(1, Level = EventLevel.Verbose, Channel = EventChannel.Debug)]
public void Debug(string message)
{
WriteEvent(1, message);
}
[
Event(2, Level = EventLevel.Informational, Channel = EventChannel.Debug)]public void Info(string message)
{
WriteEvent(2, message);
}
[
Event(3, Level = EventLevel.Warning, Channel = EventChannel.Debug)]public void Warn(string message)
{
WriteEvent(3, message);
}
[
Event(4, Level = EventLevel.Error, Channel = EventChannel.Debug)]public void Error(string message)
{
WriteEvent(4, message);
}
[
Event(5, Level = EventLevel.Critical, Channel = EventChannel.Debug)]public void Critical(string message)
{
WriteEvent(5, message);
}
}
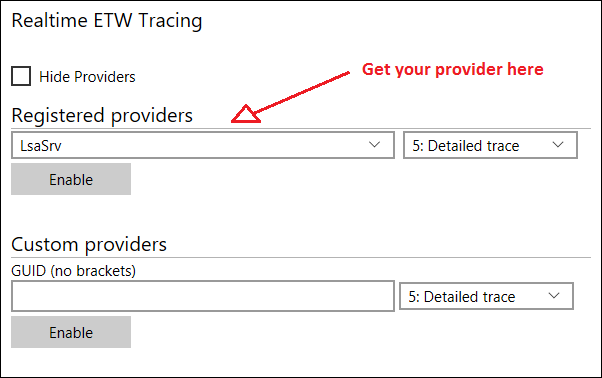
I wanted the trace logs from my IoT background service to be shown in web interface of my RaspberryPi. But no matter what I tried my traces just didn’t got there. Yes, I also tried this custom providers stuff by GUID but still no luck. So I started looking for the way how to get my event source to be registered.
Registering ETW trace provider
After some searching from the web I found a working solution. There’s some tricking and hacking needed to get the new event source registered. Here are steps.
- Add reference to NuGet package Microsoft.Diagnostics.Tracing.EventSource
- Build application, get error and take the failed command with copy and paste to some text editor. Remove all other stuff besides the command that was run. It should look similar to this:
“C:\Users\XXX\.nuget\packages\Microsoft.Diagnostics.Tracing.EventRegister\1.1.28\build\eventRegister.exe” -DumpRegDlls @”D:\Projects\TemperatureStation\TemperatureStation.IoT.Service\bin\ARM\Debug\
TemperatureStation.IoT.Service.eventRegister.rsp” “D:\Projects\TemperatureStation\TemperatureStation.IoT.Service\
bin\ARM\Debug\TemperatureStation.IoT.Service.winmdobj” - Remove reference to Microsoft.Diagnostics.Tracing.EventSource. Your application builds now again but the package is still available at your machine.
- Change file name in previously copied command from winmdobj to winmd (important!):
“C:\Users\XXX\.nuget\packages\Microsoft.Diagnostics.Tracing.EventRegister\1.1.28\build\eventRegister.exe” -DumpRegDlls @”D:\Projects\TemperatureStation\TemperatureStation.IoT.Service\bin\ARM\Debug\
TemperatureStation.IoT.Service.eventRegister.rsp” “D:\Projects\TemperatureStation\TemperatureStation.IoT.Service\
bin\ARM\Debug\TemperatureStation.IoT.Service.winmd” - Take command with copy-paste and run it on command prompt.
- Check if two new files were created to bin folder of application. Names are similar to ones I got with my TemperatureStation IoT service:
– TemperatureStation.IoT.Service.TemperatureStationEventSource.etwManifest.dll
– TemperatureStation.IoT.Service.TemperatureStationEventSource.etwManifest.man - Copy files to some folder on Raspberry.
- Log in to Raspberry using PowerShell. Move to folder where you put those two files and run the following command (replace real file names to placeholders):
wevtutil.exe im <EtwManifestManFile> /rf:”<EtwManifestDllFile>” /mf:”<EtwManifestDllFile>”
- Check through browser if your provider is listed in ETW providers list.
- If it’s not there then restart Raspberry.
Supposing everything went fine the new event source should appear in providers dropdown on ETW traces page of RaspberryPi. But there’s one little gotcha.
Saving ETW traces for later use
The previous solution works only when ETW traces are monitored through browser but the traces are not saved for later use. If trace logs must be saved then login to RaspberryPi using PowerShell and run the following command (change MyEwtProvider to the provider name you are using):
echo y | wevtutil.exe sl MyEwtProvider/Debug /e:true
To get archived trace logs use the following command on RaspberryPi when logged in using PowerShell:
wevtutil.exe qe MyEwtProvider/Debug
Saved logs should be available also on ETW traces page of RaspberryPi.
Wrapping up
ETW logging is not easy to understand and implement when doing it first time. There are many technical writings available and somehow one just have to find a way to materials needed to get simple things done. Manual registering of ETW event source was a little surprise to me. Also the fact that there is incompatible component that fails during build. But in the end I was able to get things work the way I needed. I hope it saves time for those who need ETW traces on RaspberryPi.




Comments are closed.