ASP.NET Core code coverage reports on Azure DevOps
After making ASP.NET Core code coverage reports work on local box I made step further and made code coverage reports available also on Azure DevOps. This blog post shows how to generate code coverage reports for .NET and ASP.NET Core applications on Azure DevOps.
Getting started
This blog post expects that there is .NET or ASP.NET Core project with unit tests and code coverage reports. Also it expects the existence of Azure DevOps build pipeline that is connected to source code repository. It’s covered well on previous blog post about automated testing Code coverage reports for ASP.NET Core.
Here is the build pipeline of one of my sample applications. I highlighted report generator task on screenshot. Notice also date based versioning task in pipeline.
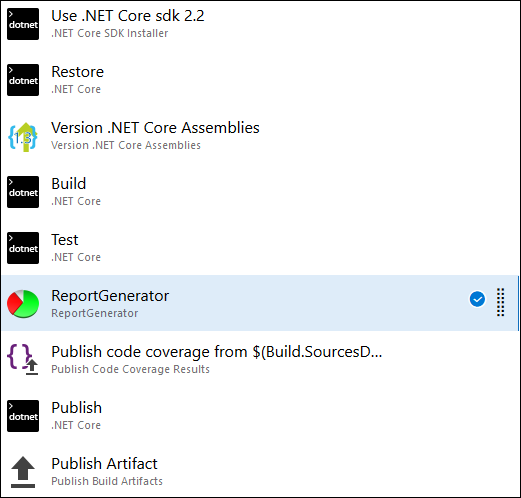
Report generator is run after tests because before tests we don’t have test results and code coverage data.
Configuring unit tests
Most of important work is done when unit tests are run. This is why we need to configure test task first. Here is the example. Telling short, we configure unit test task that runs unit tests, gathers code coverage information and saves results to build server disk. The results are XML-files we need as an input for code coverage reports.
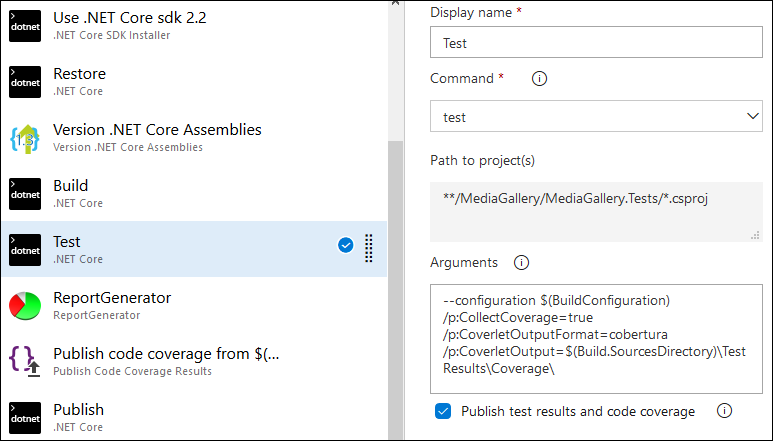
Here is the arguments block as text for copy and paste. It must be all one line with no line breaks in Arguments field of test task.
--configuration $(BuildConfiguration)
 /p:CollectCoverage=true
 /p:CoverletOutputFormat=cobertura
 /p:CoverletOutput=$(Build.SourcesDirectory)\TestResults\Coverage\
Run build to see if test task succeeds and there are no errors and warnings.
Adding code coverage reports
For code coverage reports we take free ReportGenerator task by Daniel Palme from Visual Studio Marketplace. If you need also local code coverage reports then check out ReportGenerator project from GitHub.
If organization under what build pipeline belongs doesn’t have this task yet then the task is first added to organization and then it can be added to build pipeline. Here is how to configure ReportGenerator task.
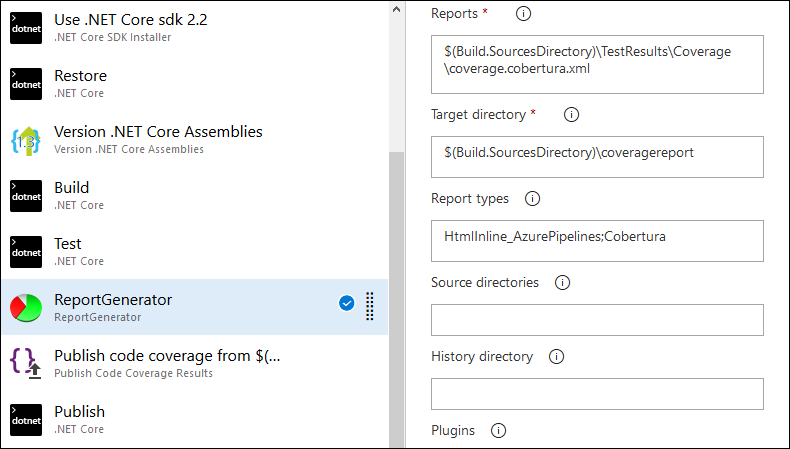
Report types field specifies what type of reports we want. Here I asked for inline HTML specially for Azure Pipelines and Cobertura. This is how I got reporting work.
NB! If you notice testing framework assemblies and namespaces (in my case xUnit) in code coverage reports then add set Assembly filter property of ReportGenerator task to: -xunit*.*. Using similar pattern it’s possible to leave out also other unwanted assemblies.
Save changes to build pipeline and run it to make sure all steps succeed and there are also no warnings by unit tests or report generator task.
Viewing code coverage reports
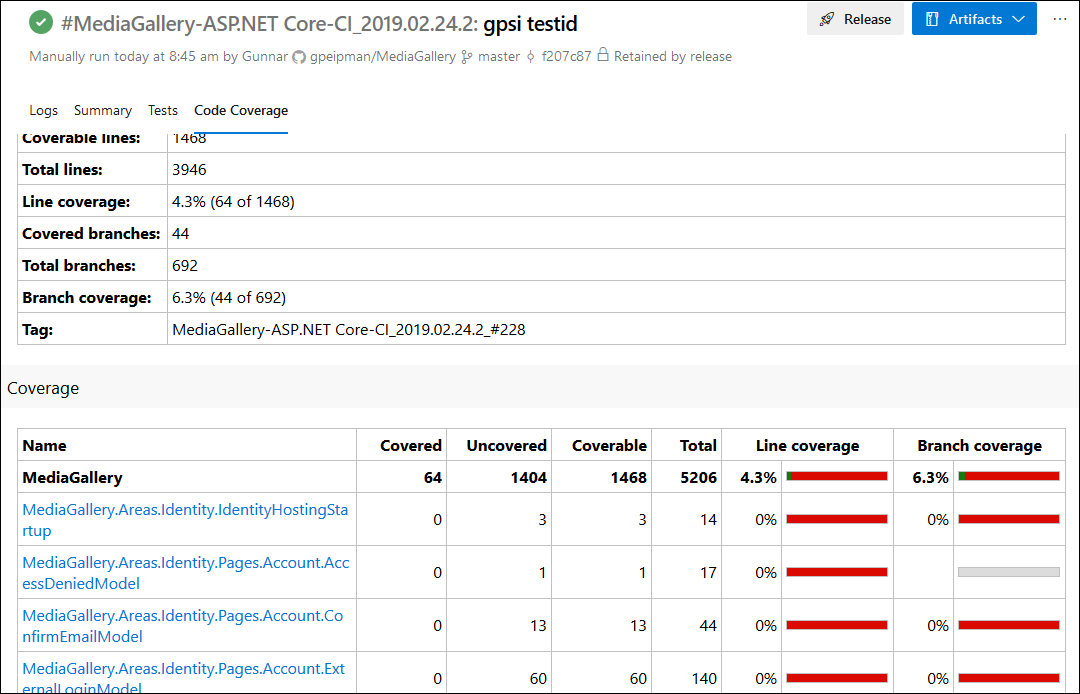
If all steps in pipeline succeeded then there will be new link to code coverage reports in header of pipeline run (in red rectangle). It is shown there automatically if code coverage information is published correctly.
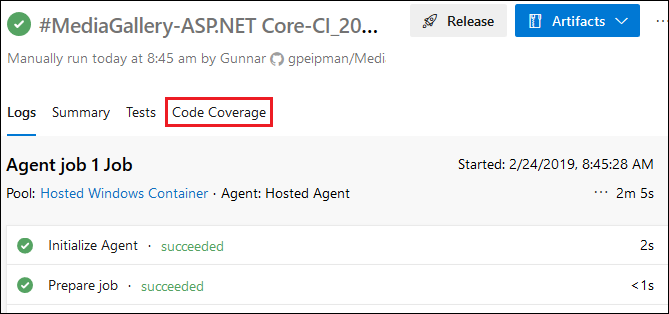
When clicking on this link we can see full code coverage report. We stay in Azure DevOps environment, in same view. Links shown in report just work with Azure DevOps environment.
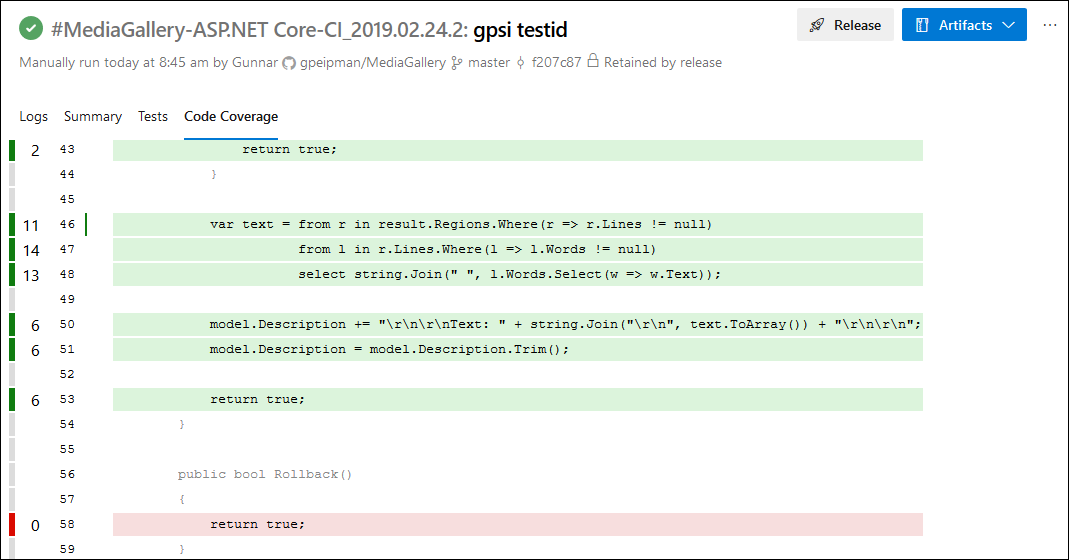
The report is interactive and we can click on class names to see more specific details about code coverage.
Reports like this are generated every time when our build pipeline is run. If we make build pipeline run on every commit to code repository then we get code coverage reports for every build automatically.
YAML version of same thing is available at Meziantou’s blog post Computing code coverage for a .NET Core project with Azure DevOps and Coverlet.
Wrapping up
We were already able to run code coverage reports on local boxes. Now we took step further and added code coverage reports to Azure DevOps build pipeline. This way we make code coverage reports available for all commits and also guys who don’t bother check reports locally can go and see their result on build server.




Would you know if this works better on node’s istanbul/nyc created coverage files ? Recently I was in a project where the “Coverage” -tab showed coverage but missed all the styling and javascript in the coverage report which was a bit awkward to browse in build results.
Azure DevOps supports Jacoco and Cobertura formats AFAIK. ReportGenerator supports today OpenCover, dotCover, Visual Studio, NCover, Cobertura, JaCoCo, Clover and Mono as input formats. If styling is missing in Azure DevOpen then make sure you use HtmlInline_AzurePipelines as output format.
Thanks for this well illustrated post! I’ve written something very similar a few days ago except I use a YAML build definition and I install ReportGenerator as a dotnet global tool instead of installing the VSTS extension. I think it could be interesting for your readers:
https://www.meziantou.net/2019/02/18/computing-code-coverage-for-a-net-core-project-with-azure-devops-and-coverlet
Thanks for feedback! Added more bold and more beautiful link straight to your blog post :)
Any idea how to get Code Coverage badges to show in the readme.md ?
Adding ;Badges to the Report Types input of the ReportGenerator task causes .svg and .png files to be created but I cannot find anything that tells me what to do next.
Azure Pipelines seems to have something built in that allows the build status badge to be linked using a url. Not sure if anything exists for more general badges.
Cool article. thank you for detailed explanation.
it is really first article that describes almost everything,
Following your example I keep getting No report files specified.
##[error]The process ‘C:\Program Files\dotnet\dotnet.exe’ failed with exit code 1.
Is there something I am doing wrong or is there a way to see where all the files are created?
When I made it work then file locations made my hair almost grey. After build you can click on problematic build steps to see their logs. This is how I found out where files were created. You can try to cd to $(Build.SourcesDirectory) and run some other command there to see what is the current folder. Actually in the end it all comes down to getting paths right.
I too am seeing the same error as TM:
– C:\Program Files\dotnet\dotnet.exe
It sounds like you’ve experienced similar issues… can either of you expand on where you landed on this?
Check out the log of failed step. There’s usually error message too about what went wrong or what exactly was not found.
Thanks a lot, you saved me a lot of time researching.
What is the optimal percentage for coverage in your opinion?
Well… it’s a subject of hot arguments and flame wars, of course :) On one end are those who are up to perfection and 100% coverage. On the other end are extremely practical guys who say that test must be written when we actually broke something. So, truth must be somewhere between.
Based on what I have read optimal coverage should be in range 60%-80%.
There’s always some code that doesn’t need to be tested. Good example are classes with automatic properties and no methods. If automatic property doesn’t work and test must fail then whole .NET Framework should be so broken that we have also no chance to run our tests.
Hi,
I am using ReportGenerator in my Azure pipeline. I am using dot test to generate the .coverage file and then using CodeCoverage.exe to convert it to xml.
Once this conversion is done, I am using reportgenerator to use this xml and generate report in a coverageresult folder.
Once the build is green, I am able to see code coverage tab but it still does not show html report. It has a link to download the coverage file.
Could you please tell what I am doing wrong here?
When I made it work on Azure DevOps I had a lot of trouble getting all paths right. Another thing is – make sure you generate report for Azure. Report types argument for ReportGenerator step must have at least one value for Azure DevOps pipeline.
Hi,
Thanks for a detailed article.
Is it possible that the publish operation with coverage HTML results is only in AzureDevOps and not on TFS 2018.
I created a Publish task but the task did not publish and created a Coverage results tab with the HTML summery.
I verified that my HTML report was created , I created it with ReportGenertor by using a CLI task . All my coverage results were made with gcovr task.
Do I miss something ?
Thanks for the Help
Hi,
I’m just wondering whether this report generator step is needed now. Azure confirms they use the ReportGenerator tool internally when you use their PublishCodeCoverage step. Like to know your thoughts. https://docs.microsoft.com/en-us/azure/devops/release-notes/2019/sprint-150-update#cobertura-code-coverage-report-updates