Code Metrics: Number of IL Instructions
In my previous posting about code metrics I introduced how to measure LoC (Lines of Code) in .NET applications. Now let’s take a step further and let’s take a look how to measure compiled code. This way we can somehow have a picture about what compiler produces. In this posting I will introduce you code metric called number of IL instructions.
NB! Number of IL instructions is not something you can use to measure productivity of your team. If you want to get better idea about the context of this metric and LoC then please read my first posting about LoC.
What are IL instructions?
When code written in some .NET Framework language is compiled then compiler produces assemblies that contain byte code. These assemblies are executed later by Common Language Runtime (CLR) that is code execution engine of .NET Framework. The byte code is called Intermediate Language (IL) – this is more common language than C# and VB.NET by example. You can use ILDasm tool to convert assemblies to IL assembler so you can read them.
As IL instructions are building blocks of all .NET Framework binary code these instructions are smaller and highly general – we don’t want very rich low level language because it executes slower than more general language. For every method or property call in some .NET Framework language corresponds set of IL instructions. There is no 1:1 relationship between line in high level language and line in IL assembler. There are more IL instructions than lines in C# code by example.
How much instructions there are?
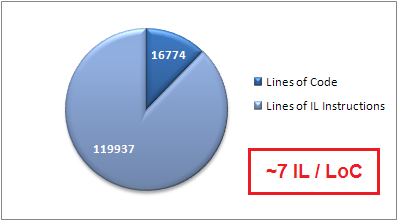
I have no common answer because it really depends on your code. Here you can see some metrics from my current community project that is developed on SharePoint Server 2007.

As average I have about 7 IL instructions per line of code. This is not metric you should use, it is just illustrative example so you can see the differences between numbers of lines and IL instructions.
Why should I measure the number of IL instructions?
Just take a look at chart above. Compiler does something that you cannot see – it compiles your code to IL. This is not intuitive process because you usually cannot say what is exactly the end result. You know it at greater plain but you don’t know it exactly. Therefore we can expect some surprises and that’s why we should measure the number of IL instructions.
By example, you may find better solution for some method in your source code. It looks nice, it works nice and everything seems to be okay. But on server under load your fix may be way slower than previous code. Although you minimized the number of lines of code it ended up with increasing the number of IL instructions.
How to measure the number of IL instructions?

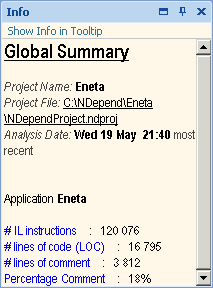
You can see over-all stats form global summary window. This is the same window I used to read the LoC and the number of IL instructions metrics for my chart. Meanwhile I made some changes to my code (enabled advanced caching for events and event registrations module) and then I ran code analysis again to get results for this section of this posting.
NDepend is also able to tell you exactly what parts of code have problematically much IL instructions. The code quality section of CQL Query Explorer shows you how much problems there are with members in analyzed code.
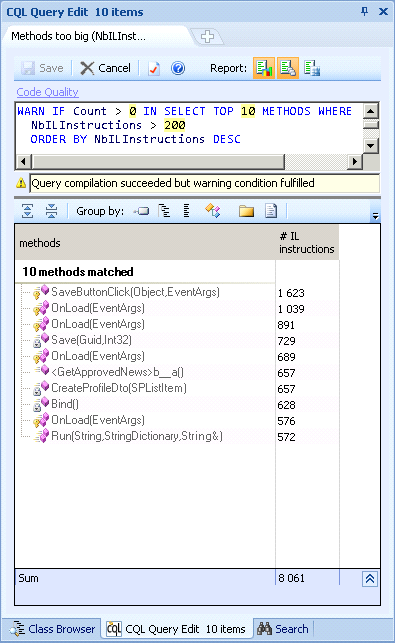
If you click on the line Methods too big (NbILInstructions) you can see all the problematic members of classes in CQL Explorer shown in image on right.
In my case if have 10 methods that are too big and two of them have horrible number of IL instructions – just take a look at first two methods in this TOP10.
Also note the query box. NDepend has easy and SQL-like query language to query code analysis results. You can modify these queries if you like and also you can define your own ones if default set is not enough for you.

What is good result?
As you can see from query window then the number of IL instructions per member should have maximally 200 IL instructions.
Of course, like always, the less instructions you have, the better performing code you have. I don’t mean here little differences but big ones.
By example, take a look at my first method in warnings list. The number of IL instructions it has is huge. And believe me – this method looks awful.
Conclusion
The number of IL instructions is useful metric when optimizing your code. For analyzing code at general level to find out too long methods you can use the number of LoC metric because it is more intuitive for you and you can therefore handle the situation more easily. Also you can use NDepend as code metrics tool because it has a lot of metrics to offer.


Interesting to see you achieve about 7 IL instructions per line of code; NDepend sets default thresholds at 30 lines of code and 200 IL instructions so a pretty close ratio by the look of it. I seem to be getting a much higher ratio (around 10) which appears to stem from having succint yet complex LINQ to SQL statements.
Thanks for feedback, Troy! :)
AFAIK LINQ queries produce more instructions because under the hood they do a lot more work than you can expect when looking at those nice and easy to read queries. So, be no surprised.