Visual Studio Code: Debugging C# code
One of my reader asked how to debug C# code using Visual Studio Code. This blog post provides simple step by step guide to C# debugging in Visua Studio Code. In short – C# extension for Visual Studio Code must be installed. Works on Windows, Linux and Apple.
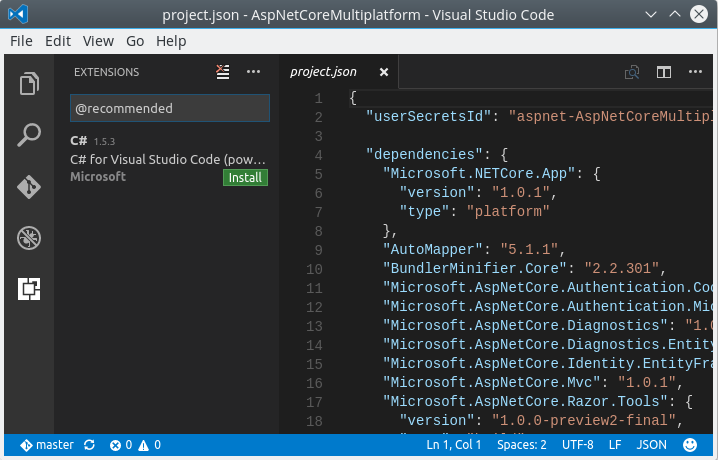
- Open extensions by clicking on last icon of icons pane in left:

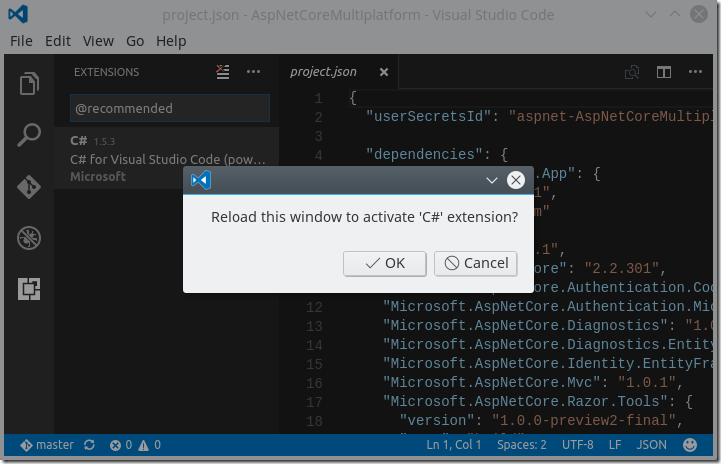
- After installing C# extension Visual Studio Code asks if it can reload window to activate the extension.

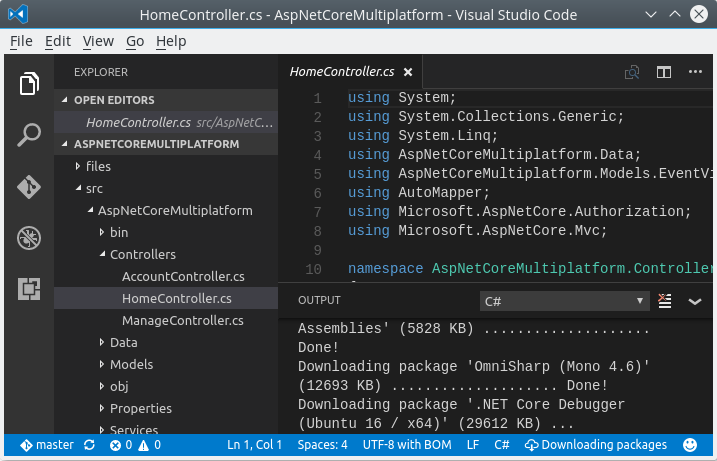
- Check output window and wait until all packages are downloaded.

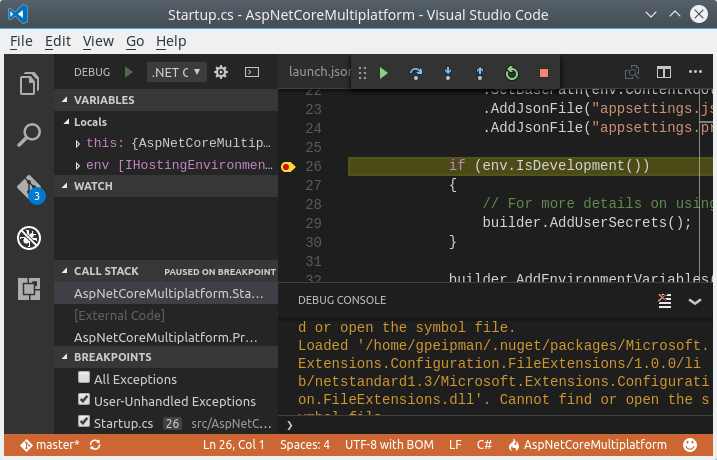
- Set break-point somewhere in code and click green arrow on toolbar after DEBUG

Screenshot above shows that there are some familiar things from Visual Studio available: Variables, watch, and callstack panes. Debug console shows debug messages by debugger and code.




Thanks for showing how to debug, I’m using Ubuntu 16.10 and I get an error when I try to debug. If I run the program with dotnet run it works fine.
The error is Failed to initialize CoreCLR, HRESULT:0x80131500
Also the message Debug adapter process has terminated unexpectedly.
I’ve searched for the error and there are a couple of posts about it but I’m not sure what to do. Do you have tips?
I have no idea what the problem is. After some struggling with Gnome, xrdp and VS Code problems I went with Kubuntu and there everything works normally. I think you can create issue at VS CodeGithub page: https://github.com/Microsoft/vscode/blob/master/CONTRIBUTING.md
Pingback:Compelling Sunday – 16 Posts on Programming and QA