Beer IoT: Using Stream Analytics to save data from IoT Hub to SQL database
When cooling beer we want to store history of temperatures for two reasons. First, it gives us valuable history data for next cooling sessions. As a second thing we can ask measurements when we temporarily lost connection with IoT Hub. In this posting we make some analyzis and then build up database for our beer cooling solution.
- Beer IoT: Measuring temperature with Windows 10 IoT Core and Raspberry Pi
- Beer IoT: Moving to ITemperatureClient interface
- Beer IoT: Measuring cooling rate
- Beer IoT: Making cooling rate calculation testable
- Beer IoT: Estimating beer cooling time
- Beer IoT: Reporting measurements to Azure IoT Hub
- Beer IoT: Using Stream Analytics to save data from IoT Hub to SQL database
- Beer IoT: Visualizing sensors data using Power BI
- Beer IoT: Building Universal Windows Application to monitor cooling process
Update. Source code of my TemperatureStation solution is available at Github. The solution contains IoT background service and web application you can use right away. Readings are reported to MSSQL or Azure IoT Hub. Documentation is available at TemperatureStation wiki. Feel free to try out the solution.
Creating SQL Azure database
I’m sure I want to brew eisbock more than once and therefore I have more than one cooling session coming. As all these sessions introduce data I want to store I need something to find out what measurements belong to what cooling session. In this point I introduce new term – batch. In brewing batch mean the concrete brew in container.
So, in total we need two tables:
- Batch – batch key, measuring state, cooling rate and device used for measuring,
- Measurement – batch key, timestamp, beer temperature, ambient tempereture.
Here is database diagram. Although we expect currently the ambient temperature to be constant this doesn’t hold always true and in the future I also want to consider situations where ambient temperature is changing (it’s important in spring and autumn when cooling takes longer due to less frost).
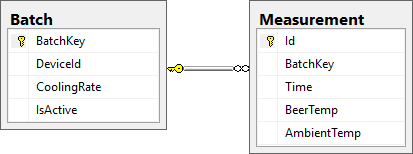
SQL script to create these two tables is here. This SQL works on Azure SQL too, so just create database there, take this script with copy-paste and run it.
CREATE TABLE [dbo].[Batch] (
    [BatchKey]    NVARCHAR (15) NOT NULL,
    [DeviceId]    NVARCHAR (15) NOT NULL,
    [CoolingRate] FLOAT (53)    CONSTRAINT [DF_Batch_CoolingRate] DEFAULT ((0)) NOT NULL,
    [IsActive]    BIT           CONSTRAINT [DF_Batch_IsActive] DEFAULT ((0)) NOT NULL,
    CONSTRAINT [PK_Batch] PRIMARY KEY CLUSTERED ([BatchKey] ASC)
)
GO

CREATE TABLE [dbo].[Measurement] (
    [Id]          INT           IDENTITY (1, 1) NOT NULL,
    [BatchKey]    NVARCHAR (15) NOT NULL,
    [Time]        DATETIME      NOT NULL,
    [BeerTemp]    FLOAT (53)    NOT NULL,
    [AmbientTemp] FLOAT (53)    NOT NULL,
    CONSTRAINT [PK_Measurement] PRIMARY KEY CLUSTERED ([Id] ASC),
    CONSTRAINT [FK_Measurement_Batch] FOREIGN KEY ([BatchKey]) REFERENCES [dbo].[Batch] ([BatchKey])
)
GO
Now we have simple SQL Azure database where we can save measurements data.
Getting data from Azure IoT Hub to SQL database
Now comes the most complex part of this show. We have to get data reported to IoT hub to SQL Azure database and we don’t want to write any code for this. Also we don’t want to write all data to database because temperature changes are not rapid and taking averages over some small time window help us keep database smaller without loosing any important information.
Here’s the full path for measurements to get from device to SQL database.

Stream Analytics is Azure service for real-time data processing and aggregating. All Stream Analytics queries are run in some time window on data that is flowing in. Stream Analytics takes data from inputs, processes it and then sends to outputs, In our case Azure IoT Hub is input and SQL database is output.
Creating Stream Analytics job
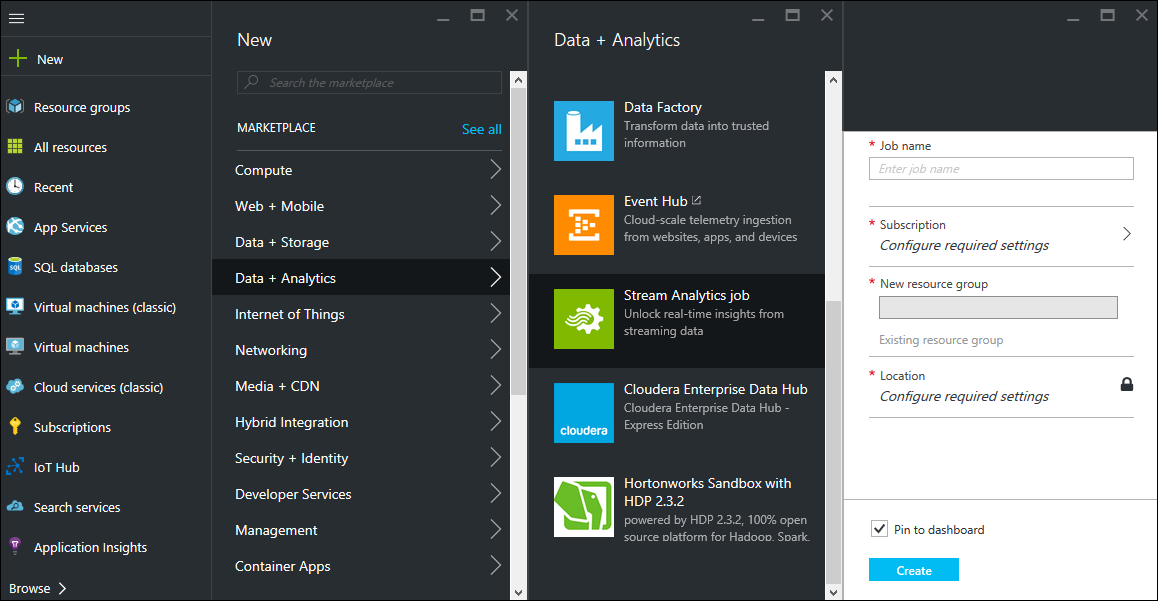
Now go to Azure portal and create new Stream Analytics job.
Adding input
When new Stream Analytics job is created you are redirected to main page of Azure portal. Browse to newly created Stream Analytics job, open it and click on Inputs box. This opens inputs list on right. Click there on Add button.
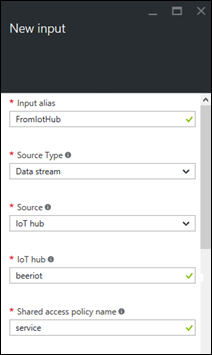
To “IoT Hub” field insert the subhost name part of your IoT Hub address. If your IoT Hub address is something.azure-devices.net then the value on “IoT hub” field must be “something”.
For shared access policy I took “service” and to shared acces key field you have to insert the key from this policy. You can find the policy key from IoT Hub settings. Just open settings in Iot Hub, select “Shared access policies” and then “service”. From policy properties window copy the value from field “Primary key” and paste it here.
When data is inserted and user saves it then Azure portal checks if new input source can be connected. Just wait some moments after clicking Save button to see if input source is okay.
Adding output
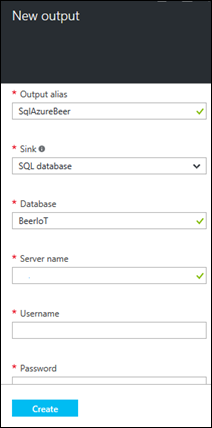
To “Database” field insert the name of the database you created before.
To “Server name” field insert your database server address. For SQL Azure the address is like something.database.windows.net. If you have database hosted by your own or if you are running SQL Server on Azure virtual machine then insert here the IP of your server because you don’t have any access to DNS servers used by Azure.
User name and password should be obviuos so skip them. Last field is Table and to this field write Measurement.
Now we have all data inserted and it’s time to save. Click “Create” to save database as new output source.
The names you gave to input and output sources are the ones you will use later when writing Stream Analytics queries. So choose these names carefully and make sure they make sense. It makes it easier to understand queries later.
Creating Stream Analytics query
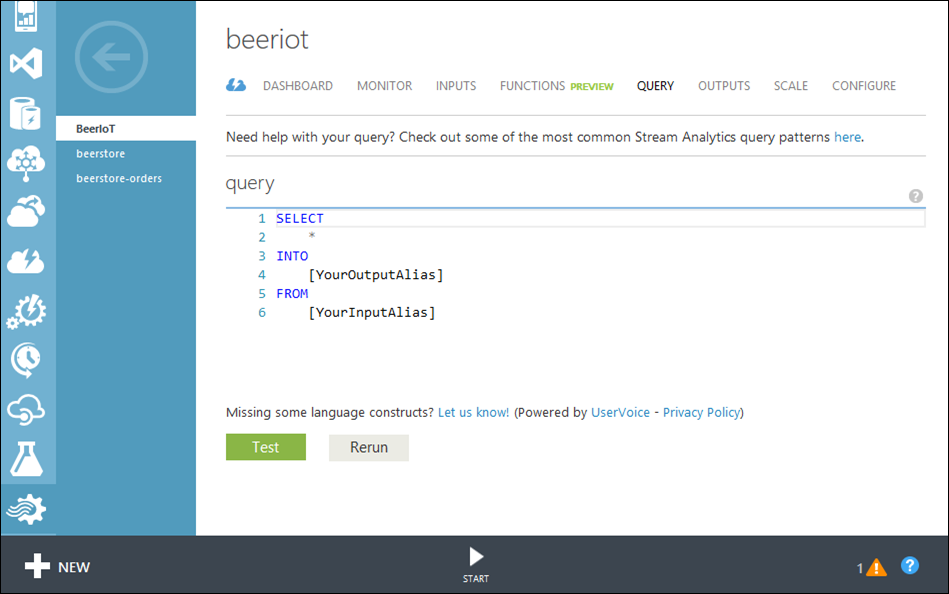
As a last thing we have to add query that is run on incoming data flow. As Azure new portal doesn’t support testing of Stream Analytics queries yet we have to switch to old management portal and insert query there.
Now things get a little bit tricky because the query must know input and output formats. On input side we have data that is structured like our measurement objects we are sending out from device. On output side we have measurements table we created above. Additionally we have to define aggregates on all numbers in our query.
Now we have one additional problem. Stream Analytics query is running on data that is coming in from data source. Currently the data we are sending to Azure IoT Hub doesn’t have information about what batch it is and there’s no way on Stream Analytics side to make the decision. We have to add batch key to data transfer object we are using to send data to Azure IoT Hub.
We add new batchKey attribute to anonymous DTO we are using in ReportMeasurement method.
private void ReportMeasurement(DateTime time, double beerTemp, double ambientTemp, double estimate)
{
    var beerMeasurement = new
    {
        deviceId = "MyDevice",
        batchKey = "Eisbock-1",
        timeStamp = time,
        beerTemp = beerTemp,
        ambientTemp = ambientTemp,
        estimate = estimate
    };

    var messageString = JsonConvert.SerializeObject(beerMeasurement);
    var message = new Message(Encoding.ASCII.GetBytes(messageString));
     _deviceClient.SendEventAsync(message).AsTask().Wait();
}
Now we can go on and write a query that saves data to SQL Azure database. Here is the Stream Analytics query.
SELECT
    batchKey as BatchKey,
    MAX(CAST([timeStamp] AS datetime)) as Time,
    AVG(beerTemp) as BeerTemp,
    AVG(ambientTemp) as AmbientTemp
INTO
    [SqlAzureBeerIoT]
FROM
    [FromIoTHub]
GROUP BY
    batchKey,
    TumblingWindow(minute, 5)
Some notes. We cast timestamp field to datetime because otherwise Stream Analytics considers it as something that should be casted to float. Not sure why it is so. As we are interested in temperatures during five minutes time windows (called also as tumbling window) we take averages of temperatures reported.
Once we run Stream Analytics job we can’t make changes there. To change something we have to stop the job and then do our modifications.
Adding first batch to database
Before we can start gathering data we need at least one batch to be available in Batch table. Add new batch with following data:
BatchKey: Eisbock-1
DeviceId: MyDevice
IsActive: 1
After adding this row to Batch table we are ready to run to test if data gets from IoT Hub to SQL Azure database.
Testing Stream Analytics job
Now run Stream Analytics job and open your IoT Hub so you see its dashboard. Also open your database in SQL Server Management Studio and be ready to make select from Measurement table. Run beer cooling solution and see if data starts coming. To SQL Azure data comes with some delay. It depends on how wide is data window over what we are aggregating the results.
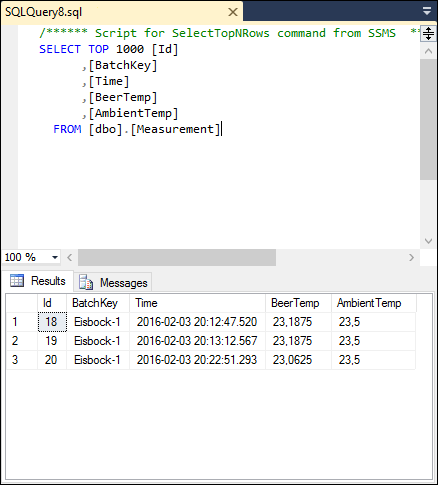
If everything is okay then soon you shoud see new data in Measurement table. If time window is five minutes then you should wait at least five minutes before you see any data.
Wrapping up
This was long post full of analyzis and configuring of services but we made it and now our data is flowing from IoT Hub to SQL Azure database. As we are aggregating measurement results over time windows of 5 minutes we store less data than is coming in but still we don’t loose much and for next batches we have useful historical data to take.






nice article. thanks
Thank you again for this reference. I found it extremely helpful for a project of mine. :)