
Visualize Azure CDN metrics with Grafana
Azure CDN is one of Azure services that doesn’t provide charts and metrics in service overview page. For me these charts are important because they help me to optimize delivery of my blog artifacts. This blog post describes how I visualize Azure CDN diagnostics logs using InfluxDB, Grafana and simple data collector.
Enabling diagnostics logs on Azure CDN
To get data about Azure CDN we have to turn on diagnostics logs from Azure Portal like shown on the following image. For diagnostics logs I’m using cheapest V1 blob storage.

Diagnostics logs are saved to blob container called insights-logs-coreanalytics.
Want to set up Azure CDN? My blog post Taking Jekyll static blog live with Azure CDN and custom domain gives brief guide how to set up Azure CDN with custom domain and HTTPS. This is what majority of sites need when they move to Azure CDN.
Exploring Azure CDN diagnostics logs
Logs are written to deep folder structure that seems awkward at first sight. It’s actually practical as the structure allows container to have logs from different services. We may need this if we have more than one Azure CDN endpoint to monitor.
Here’s one example of log file path on blob container:
/resourceId=/SUBSCRIPTIONS/DA512CA3-323C-4189-3353-6AE64D13AA40/RESOURCEGROUPS/BLOG/PROVIDERS/MICROSOFT.CDN/PROFILES/GPFBLOG-CDN/ENDPOINTS/GPFBLOG/y=2019/m=08/d=20/h=06/m=00/PT1H.json
We get logs for every hour and for each domain going through endpoint there is separate log entry. It’s not normal JSON-file as entries are JSON-objects each one at separate line. Here’s the example of one log entry.
{
  "time": "2019-08-20T04:00:00",
  "resourceId": "/SUBSCRIPTIONS/DA512CA3-323C-4189-3353-6AE64D13AA40/RESOURCEGROUPS/BLOG/PROVIDERS/MICROSOFT.CDN/PROFILES/GPFBLOG-CDN/ENDPOINTS/GPFBLOG",
  "operationName": "Microsoft.Cdn/profiles/endpoints/contentDelivery",
  "category": "CoreAnalytics",
  "properties": {
    "DomainName": "gpfblog.azureedge.net",
    "RequestCountTotal": 125,
    "RequestCountHttpStatus2xx": 123,
    "RequestCountHttpStatus3xx": 0,
    "RequestCountHttpStatus4xx": 2,
    "RequestCountHttpStatus5xx": 0,
    "RequestCountHttpStatusOthers": 0,
    "RequestCountHttpStatus200": 123,
    "RequestCountHttpStatus206": 0,
    "RequestCountHttpStatus302": 0,
    "RequestCountHttpStatus304": 0,
    "RequestCountHttpStatus404": 2,
    "RequestCountCacheHit": 109,
    "RequestCountCacheMiss": 16,
    "RequestCountCacheNoCache": 0,
    "RequestCountCacheUncacheable": 0,
    "RequestCountCacheOthers": null,
    "EgressTotal": 0.001755335,
    "EgressHttpStatus2xx": 0.0,
    "EgressHttpStatus3xx": 0.0,
    "EgressHttpStatus4xx": 0.0,
    "EgressHttpStatus5xx": 0.0,
    "EgressHttpStatusOthers": 0.001755335,
    "EgressCacheHit": 0.001452786,
    "EgressCacheMiss": 0.000454804,
    "EgressCacheNoCache": 0.0,
    "EgressCacheUncacheable": 0.0,
    "EgressCacheOthers": null
  }
}
NB! Long table explaining these metrics is available at Azure CDN documentation page Azure diagnostic logs. Same page also describes how to visualize logs using Azure Monitor.
With this knowledge in mind let’s write data collector for Grafana and InfluxDB.
Writing Azure CDN diagnostics collector for InfluxDB
I’m using Grafana and InfluxDB to monitor some machines in home network and few machines on Azure that doesn’t support or have problems with Azure monitoring tools.
Example from practice. To see how InfluxDB and Grafana help me to monitor system memory on some Azure VM-s where diagnostics doesn’t work stable read my blog posts Displaying ASP.NET Core health checks with Grafana and InfluxDB and System memory health check for ASP.NET Core.
I wrote simple data collector for Azure CDN that reads logs from blob storage and pumps them to InfluxDB. It’s time series database that Grafana uses as a data source.
Let’s start with configuration file as I don’t like to hardcode settings that may change over time. I added classic appSettings.json file to my solution and made Visual Studio to copy it to output folder with every build.
{
  "StorageConnectionString": "<YOUR CONNECTION STRING HERE>",
  "ContainerName": "insights-logs-coreanalytics",
  "InfluxdbWriteUrl": "http://192.168.10.117:8086/write?db=telegraf",
  "MeasurementName": "blogcdn"
}
To get JSON mess shown above easily to some usable form we will use LogEntry class for this.
public class LogEntry
{
    [JsonPropertyName("time")]
    public DateTime Time { get; set; }

    [JsonPropertyName("properties")]
    public Dictionary<string, object>  Properties {get; set; }
}
Notice the trick with Dictionary<string,object>. Instead of creating big class with all properties we will use dictionary. Why it is important? Using same trick we can reuse this code to write InflusDB data collectors for other Azure services we need.
NB! This program is written on .NET Core 3.0. For now we have green light by Microsoft to use it in production and it’s time to make the move.
Here is the program class of my console application I’m running as Azure CDN data collector.
internal class Program
{
    private static string InfluxdbWriteUrl;
    private static string StorageConnectionString;
    private static string CdnCoreAnalyticsBlobContainerName;
    private static string MeasurementName;

    private static async Task Main(string[] args)
    {
        LoadConfig();

        var storageAccount = CloudStorageAccount.Parse(StorageConnectionString);
        var client = storageAccount.CreateCloudBlobClient();
        var container = client.GetContainerReference(CdnCoreAnalyticsBlobContainerName);
        BlobContinuationToken blobContinuationToken = null;

        do
        {
            // Consider large containers and use paging
            var resultSegment = await container.ListBlobsSegmentedAsync(
                prefix: null,
                useFlatBlobListing: true,
                blobListingDetails: BlobListingDetails.None,
                maxResults: null,
                currentToken: blobContinuationToken,
                options: null,
                operationContext: null
            );

            blobContinuationToken = resultSegment.ContinuationToken;

            foreach (CloudAppendBlob blob in resultSegment.Results)
            {
                var split = blob.Name.Split('/');
                var profile = split[8];
                var endpoint = split[10];
                var year = int.Parse(split[11].Split('=')[1]);
                var month = int.Parse(split[12].Split('=')[1]);
                var day = int.Parse(split[13].Split('=')[1]);
                var hour = int.Parse(split[14].Split('=')[1]);
                var minute = int.Parse(split[15].Split('=')[1]);
                var time = new DateTime(year, month, day, hour, minute, 0);

                using (var memoryStream = new MemoryStream())
                {
                    blob.DownloadToStream(memoryStream);

                    var text = Encoding.UTF8.GetString(memoryStream.ToArray());
                    var textParts = text.Split("\n", StringSplitOptions.RemoveEmptyEntries);

                    foreach (var textPart in textParts)
                    {
                        var entry = JsonSerializer.Deserialize<LogEntry>(textPart.Trim());
                        var properties = entry.Properties;
                        var domainName = properties["DomainName"];

                        properties.Remove("DomainName");

                        var buffer = new StringBuilder(1024);
                        buffer.Append(MeasurementName);
                        buffer.Append(",host=");
                        buffer.Append(domainName);
                        buffer.Append(" ");

                        var values = properties.Select(e => e.Value == null ? "" : e.Key + "=" + e.Value)
                                                .Where(e => !string.IsNullOrEmpty(e))
                                                .ToArray();

                        buffer.Append(string.Join(',', values));

                        var epochStart = new DateTime(1970, 1, 1, 0, 0, 0, DateTimeKind.Utc);
                        var stamp = (entry.Time.ToLocalTime() - epochStart).Ticks * 100;
                        buffer.Append(" ");
                        buffer.Append(stamp);

                        await PostToInfluxDb(buffer.ToString());
                    }
                }
            }

        } while (blobContinuationToken != null);
    }

    private static async Task PostToInfluxDb(string body)
    {
        using (var content = new StringContent(body))
        using (var client = new HttpClient())
        {
            var response = await client.PostAsync(InfluxdbWriteUrl, content);
            var responseBody = await response.Content.ReadAsStringAsync();
        }
    }

    private static void LoadConfig()
    {
        var builder = new ConfigurationBuilder();
        builder.AddJsonFile("appsettings.json", optional: false);

        var configuration = builder.Build();

        StorageConnectionString = configuration.GetSection("StorageConnectionString").Value;
        InfluxdbWriteUrl = configuration.GetSection("InfluxdbWriteUrl").Value;
        CdnCoreAnalyticsBlobContainerName = configuration.GetSection("ContainerName").Value;
        MeasurementName = configuration.GetSection("MeasurementName").Value;
    }
}
This code needs the following Nuget packages:
- Microsoft.Azure.Storage.Blob
- Microsoft.Extensions.Configuration
- Microsoft.Extensions.Configuration.Json
Azure CDN diagnostics metrics are now pumped to InfluxDB and it’s time to visualize data.
Grafana: Visualizing requests to Azure CDN
One of important charts I have is the one with requests stats. I want to see how many requests were done to CDN and how many of these succeeded or failed. Big number of requests served from cache is good. It means that users get most of content from the nearest edge server.
There are also requests that missed cache for some reason. It can be edge server where content was not yet available but it can also be a problem with cache headers in origin server (in my case it’s regular Azure blob storage).
To get these three metrics visualized, open Grafana in browser, create new dashboard and add new graph type panel. Here is my query for Azure CDN requests.

These queries give us the following chart.

My chart shows pretty good situation – roughly 75% of requests are served from Azure CDN cache. I’m a little bit worried of cache misses count but I don’t optimize anything until I find out why the number is around 30% of requests.
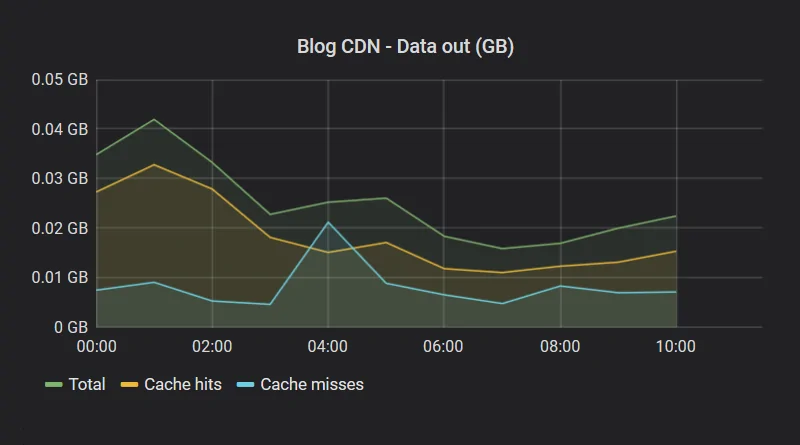
Grafana: Visualizing Azure CDN egress data
Another important chart is the one visualizing how much data is flowing out from Azure CDN in total and how it distributes between cache hits and misses. Cache misses on this chart show how much data was dragged from my blob storage through Azure CDN.
Here is my Grafana query for data out chart.

Here is the resulting data out chart.

It looks a little bit similar by data to requests chart but take a look how cache misses are playing on both charts.
Wrapping up
Azure services that doesn’t have metrics or diagnostics shown on service overview page have ofter diagnostics logs available. These logs can be downloaded from Azure blob storage and pumped to InfluxDB to visualize them on Grafana. Turning diagnostics logging on was easy and writing almost generic data collector was also pretty easy task. We used Dictionary<string, object> to deserialize diagnostics data to dictionary and transform dictionary to InfluxDB insert query. All we had to do on Grafana was to build two charts to visualize requests to Azure CDN and data flow from there.


